
The Foundation of Progress
Education shapes the destiny of nations, crafting the minds that will define the future. My investigation into educational indicators across 53 countries sheds light on the transformative power of education, and its profound impact on youth and adults alike.
Gender Disparities: A Barrier to Equality
Upon analyzing the youth literacy rates across 53 countries for both males and females, a compelling narrative about the state of global education, gender disparities, and the intersection of geography and development has been brought forward.
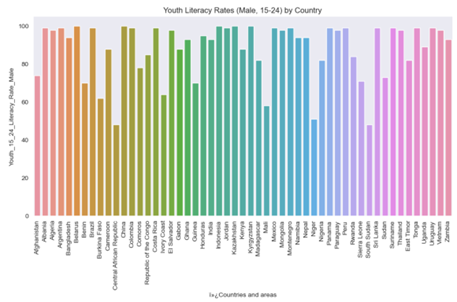
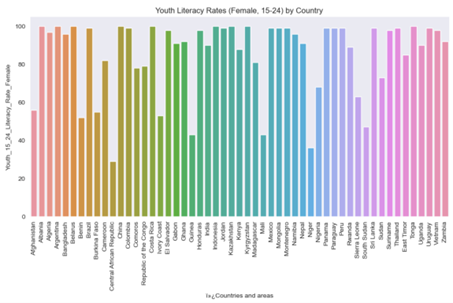
The bar graphs vividly depict the literacy rates among youths aged 15-24, revealing striking differences between genders within certain countries. A pronounced disparity is observed in several African nations such as Benin, Central African Republic, Ivory Coast, Guinea, Mali, and Niger. In these countries, male literacy rates outpace those of females – in Guinea, the literacy rate of females is 60% of the male literacy rate. This is nothing but a reflection of deep-seated gender inequalities that pervade many facets of societal structure.
This gender gap in literacy rates is particularly concerning given that these countries share not only geographic proximity but also similar challenges of underdevelopment. Their status as developing nations is often characterized by low GDPs and limited resources, factors that invariably affect the quality of education provided. High dropout rates are a significant issue, particularly for girls, who are often compelled by socio-cultural norms and economic necessities to forgo formal education.
Yet, these patterns are not universal.
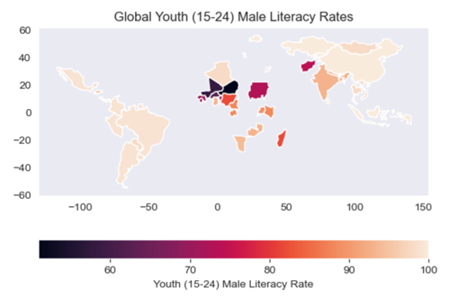
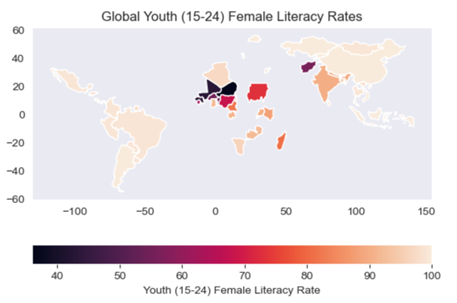
In regions such as Europe and parts of Asia, youth literacy rates are high and show less disparity between genders. This invites questions: How have these regions achieved such equity, and what lessons can be gleaned from their educational policies and societal structures? The answer often lies in a combination of factors including but not limited to government investment in education, cultural values that promote gender equality, and social safety nets that alleviate economic pressures on families.
Education is a right, not a privilege, and ensuring that right for all genders is essential for the holistic development of any country.
The Economic Canvas: Education and Employment
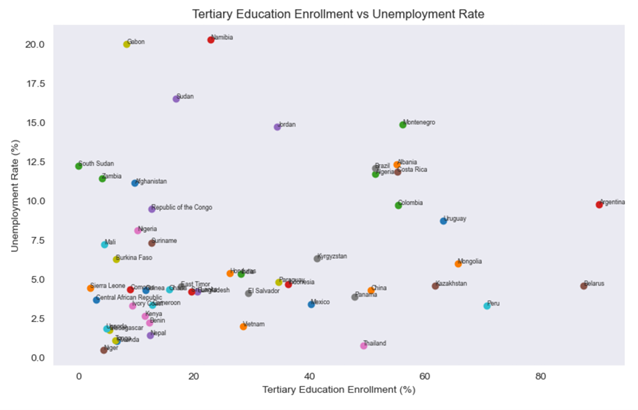
The above scatter plot presents a visual analysis comparing gross tertiary education enrollment percentages with unemployment rates for various countries. On the x-axis, we have the gross tertiary education enrollment rate, which reflects the percentage of the population enrolled in higher education institutions, relative to the total eligible population. The y-axis represents the unemployment rate.
From the scatter plot, we can observe a trend where countries with higher enrollment in tertiary education tend to exhibit lower unemployment rates. In Belarus, for example, 87.4% students enrolled for tertiary education due to which the unemployment rate of the country is a low 4.59%. This suggests that access to higher education could be linked to better employment prospects since higher education equips individuals with advanced skills and knowledge, which are valued in the job market.
However, the plot also reveals several outliers—countries where high levels of tertiary education enrollment do not correspond to low unemployment rates, or vice versa. These anomalies highlight that enrollment alone is an insufficient predictor of employment outcomes. The quality of education, the alignment between educational programs and the demands of the job market, and the overall economic conditions of a country are critical factors that influence these rates.
To further elaborate, a country with high tertiary enrollment but a high unemployment rate might be experiencing a mismatch between the skills taught in educational institutions and those demanded by employers. Conversely, a country with low tertiary enrollment but low unemployment might have a strong vocational training system or a high demand for labor in sectors that do not require tertiary education.
In sum, this graph underscores the complex relationship between education and employment. It serves as a prompt for policymakers to assess not only how to increase access to higher education but also how to enhance its quality and relevance to current and future economic needs.
The Decline of Completion Rates: A Socio-economic Ripple Effect
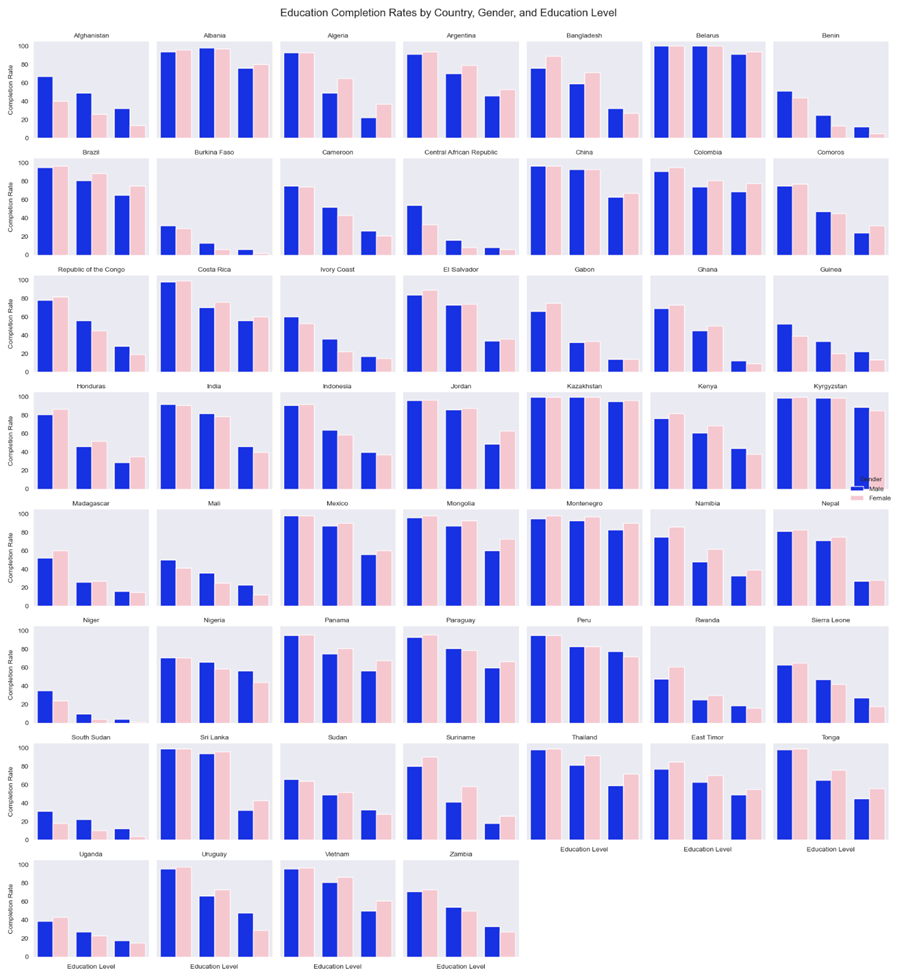
The above series of bar graphs offers a detailed comparison of education completion rates across various countries, broken down by gender and education level. The visualizations compare the completion rates for primary, lower secondary, and higher secondary education, with separate bars for male and female students for each of the 53 countries.
From the graphs, it’s evident that primary education generally has the highest completion rates. This is expected as primary education forms the foundation and is often prioritized in policy and funding. However, as the education level progresses to lower secondary and then higher secondary, a decline in completion rates is noticeable. This trend is a common issue in many countries and points to challenges such as access to education, economic factors that necessitate early workforce entry, or insufficient support for students as they progress through their education.
The impact of lower completion rates is multifaceted:
- It contributes to a lower-skilled labor force, which can hinder economic progress and adaptation to a rapidly changing global job market.
- It may perpetuate cycles of poverty, especially when girls are not completing their education, as this limits their employment opportunities and potential to contribute to economic growth.
- It affects a country’s ability to improve other socio-economic outcomes, such as health, civic participation, and gender equality.
These graphs serve as a call to action for policymakers and educational leaders to investigate the underlying causes of dropout rates and gender disparities. They highlight the need for targeted interventions that includes improving access to secondary and tertiary education.
Call to Action: Policy Implications
The insights from these visualizations suggest several policy recommendations:
- Implementing gender-sensitive educational programs to close the literacy gap.
- Investing in quality education that aligns with labor market needs.
- Supporting students beyond primary education to prevent drop-offs at higher levels.
In closing, the discourse on education is not just a narrative of numbers but a story of human potential and societal evolution. The gender disparities in literacy rates, the relationship between education and employment, and the completion rates across educational levels are all threads in the same tapestry that depict a country’s journey towards growth and development. It is incumbent upon us to weave policies and practices that ensure education for all, fostering a world where every individual’s potential can be fully realized.
All the data used above is taken from NIDULA ELGIRIYEWITHANA who created the dataset, “Introduction to World Educational Data”